observability
extension
1 skill
OpenTelemetry observability — trace errors and agent turns across piclaw instances to Azure Application Insights (with Live Metrics) and local Graphite
OpenTelemetry observability for piclaw — trace errors and agent turns across multiple instances to Azure Application Insights (with Live Metrics Stream) and local Graphite.
Requires Piclaw >=2.0.0.
Uses the runtime's structured log-sink contract. The runtime never imports OTel — it just logs structured records. This addon subscribes to those records and creates OTel spans, exceptions, and Graphite metrics from them.
The add-on keeps one telemetry/exporter runtime per Piclaw process and multiplexes all chat/session activity through shared tracer state keyed by chatJid, turnId, and sessionLeafId. A single session shutting down does not tear down telemetry for other active sessions.
Open Settings → Add-Ons and install observability from the catalog.
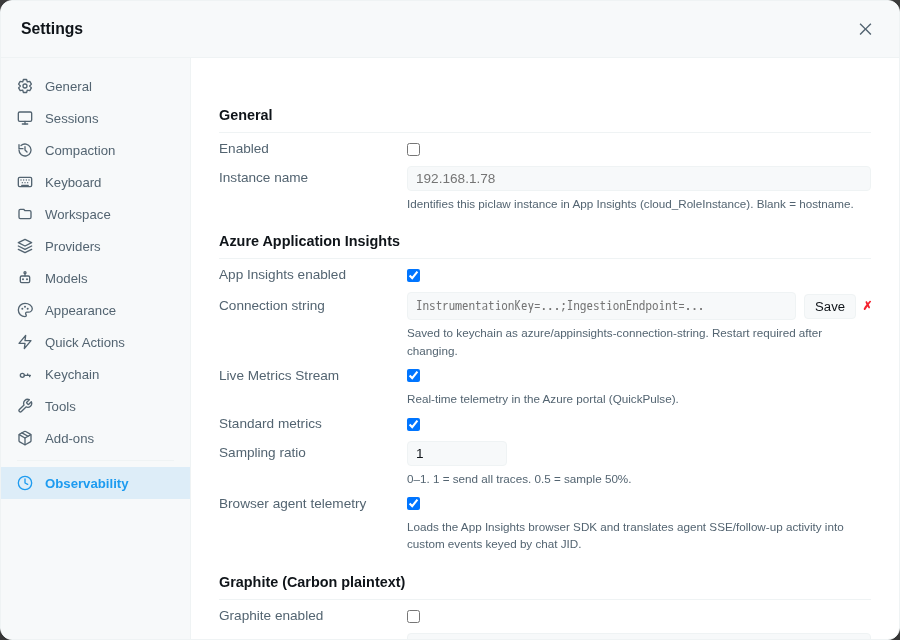
The pane loads/saves non-secret settings through the direct backend add-on config API (/agent/addons/api/observability/config). The connection string can be pasted directly into the settings pane — it is saved to the keychain automatically as azure/appinsights-connection-string. Changes are applied live to the process-wide telemetry runtime.
| Field | Type | Default | Description |
|---|---|---|---|
| Enabled | checkbox | off | Master switch |
| Instance name | text | hostname() |
Identifies this instance in App Insights (cloud_RoleInstance). Set to e.g. smith, relay, orangepi. |
| App Insights enabled | checkbox | on | Sub-toggle for the Azure backend |
| Connection string | password | — | Paste the App Insights connection string directly. Saved to keychain as azure/appinsights-connection-string. |
| Live Metrics Stream | checkbox | on | Real-time telemetry in the Azure portal (QuickPulse) |
| Standard metrics | checkbox | on | OTel standard metrics collection (CPU, memory, request rate) |
| Sampling ratio | number | 1 | 0–1. 1 = send all traces. 0.5 = sample 50%. |
| Graphite enabled | checkbox | off | Sub-toggle for Carbon plaintext push |
| Host | text | — | Graphite/Carbon receiver host, e.g. 192.168.1.250 |
| Port | number | 2003 | Carbon plaintext port |
| Metric prefix | fixed | piclaw |
Root prefix for all Graphite metric paths |
| Export usage and compaction telemetry | checkbox | off | Export local token_usage aggregates plus bounded compaction timing/outcome metrics by instance and model. Requires Graphite enabled. |
| Export interval | number | 15 min | Durable usage/compaction export cadence (1–60 minutes). |
| Graphite render URL | text | — | Optional endpoint used by the bundled usage-telemetry-chart SVG helper. |
| What | Where |
|---|---|
| App Insights connection string | Keychain — entry azure/appinsights-connection-string. Entered directly in the settings pane. |
| All other settings | Runtime database — extension KV store (SQLite, global scope, extension ID observability) |
| App Insights actor/session identity | Derived on the backend from Piclaw log records (chatJid, sessionLeafId, turnId) |
No config files are written to disk. When token usage export is enabled, bounded retry spools are written beside the messages database (usage-telemetry/ and compaction-telemetry/): each is limited to 7 days or 10 MB and is used only when Carbon delivery fails.
Each piclaw instance needs:
instance_name set to a unique value in Settings → ObservabilityThe addon uses piclaw's log-sink contract — a generic API that any addon can use. Server-side spans are derived from runtime records. The add-on does not install browser telemetry, wrap fetch, wrap EventSource, or load the browser Application Insights SDK.
Server side:
runtime                              addon
───────                              ─────
log.info("Prompting session", {
  operation: "run_agent.prompt",     ──►  sink receives record
  chatJid: "web:default",                 creates Span "agent.turn"
  model: "azure-openai/gpt-5-4",         stores in inflightTurns map
})

  ... model runs, tools fire ...

log.info("Tool execution ended", {
  operation: "tool.call.end",        ──►  sink receives record
  chatJid: "web:default",                 creates child Span "tool.call"
  toolName: "bash",                       pushes Graphite metric
  durationMs: 320,
})

log.info("Agent run completed", {
  operation: "run_agent.complete",   ──►  sink receives record
  chatJid: "web:default",                 finds inflight span
  durationMs: 4523,                       ends span → App Insights
})                                        pushes Graphite metrics
If the addon isn't installed, no sink is registered and there is zero overhead.
See the runtime observability docs for the full log-sink API and operation reference.
| OTel Resource attribute | App Insights field | Value |
|---|---|---|
service.name |
cloud_RoleName |
piclaw |
service.instance.id |
cloud_RoleInstance |
config instance_name (or hostname) |
host.name |
— | always OS hostname() |
deployment.environment |
custom dimension | auto-detected: docker / lxc / host-native |
service.version |
— | piclaw package version |
The goal is to make the standard Application Insights UX behave as if Piclaw were a normal web application, while still deriving all telemetry from backend runtime events.
| App Insights concept | Piclaw source | OTel/App Insights fields emitted |
|---|---|---|
| User | Chat/agent actor | enduser.id = chatJid, enduser.pseudo.id = chatJid, piclaw.chat_jid, piclaw.actor.id |
| Authenticated user | Same stable actor identity | Azure Monitor maps enduser.id to ai.user.authUserId; ai.user.authUserId is also kept as a custom dimension |
| User ID | Same stable actor identity | Azure Monitor maps enduser.pseudo.id to ai.user.id; ai.user.id is also kept as a custom dimension |
| Session | Piclaw runtime session/fork | session.id, ai.session.id, piclaw.session.id; value is sessionLeafId when available, otherwise chatJid |
| Operation / transaction | One agent turn | piclaw.turn_id; child model/tool spans share the same trace/operation |
| Request | User-visible agent turn | agent.turn SERVER span, request-style attributes (http.route=/agent/turn) |
| Dependency | Work performed by the turn | model.call and tool.call CLIENT/dependency spans; provider.error is an error span |
| Metrics | Spend and performance | token dimensions on model.call, duration/count metrics in Graphite, standard Azure Monitor metrics when enabled |
Azure Monitor's OpenTelemetry exporter maps:
| OTel attribute | App Insights field |
|---|---|
enduser.id |
ai.user.authUserId |
enduser.pseudo.id |
ai.user.id |
The exporter does not currently map session.id into the App Insights session tag for spans, so the add-on emits both standard (session.id) and App Insights-style (ai.session.id) attributes as queryable dimensions. This keeps the data available in Transaction Search/KQL and gives us a single place to add a custom exporter/processor later if needed.
Browser telemetry is intentionally absent. The web entry only registers the Settings pane. Front-end actions should be represented by backend log records and then mapped by this add-on into synthetic App Insights requests/events/spans. This keeps telemetry consistent across web, mobile, WhatsApp, scheduled tasks, and other channels.
| Log operation | OTel Span | Graphite metric |
|---|---|---|
run_agent.prompt → run_agent.complete |
agent.turn (request-style span; paired by turnId, fallback chatJid) |
agent.turn.count, agent.turn.duration_ms, agent.turn.success |
run_agent.prompt → run_agent (error) |
agent.turn (request-style span; ERROR + exception) |
agent.turn.count, agent.turn.error |
run_agent.no_terminal_reply |
agent.turn (request-style span; ERROR) |
agent.turn.error |
model.call.start → model.response.end |
model.call (dependency-style child span of agent.turn) with latency, generation, usage and throughput dimensions |
legacy model.call.* plus provider/model-dimensional model.<provider>.<model>.* |
run_agent.attempt_failed |
provider.error (exception) |
recovery.attempts, provider.error.<classifier> |
tool.call.start/end |
tool.call (dependency-style child span of agent.turn) |
tool.<name>.count, tool.<name>.duration_ms |
dream.complete |
dream |
dream.duration_ms |
compaction.telemetry |
compaction |
durable <instance>.compaction.<provider>.<model>.<method>.<execution>.<trigger>.<outcome>.<timeout-stage>.* metrics |
get_or_create.create_main_session |
— | session.created |
evict_idle.* |
— | session.evicted |
Any warn/error with operation |
log.warn / log.error |
— |
These interactions should be emitted by the backend as structured log records and then mapped here into App Insights request/event-style spans:
| Interaction | Backend source | Suggested App Insights item | Identity/session |
|---|---|---|---|
| User sends a message | handle_agent_message accepted payload |
agent.message.sent |
chatJid, sessionLeafId when known |
| Message queued as follow-up | queue/follow-up backend path | agent.followup.queued |
chatJid, active turnId when known |
| Queued follow-up consumed | follow-up materialization path | agent.followup.consumed |
chatJid, next turnId |
| Queued follow-up removed | queue remove backend handler | agent.followup.removed |
chatJid |
| Steering message queued | steer backend path | agent.steer.queued |
chatJid, active turnId when known |
| Model changed | backend model command path | agent.model.changed |
chatJid |
| UI command handled | backend command handlers | agent.ui.command |
chatJid |
{
  "name": "agent.turn",
  "kind": "SERVER",
  "status": { "code": "OK" },
  "duration": "4523ms",
  "attributes": {
    "piclaw.chat_jid": "web:default:branch:0f3858079ad7",
    "piclaw.actor.kind": "chat_jid",
    "piclaw.actor.id": "web:default:branch:0f3858079ad7",
    "enduser.id": "web:default:branch:0f3858079ad7",
    "enduser.pseudo.id": "web:default:branch:0f3858079ad7",
    "session.id": "session-leaf-123",
    "ai.session.id": "session-leaf-123",
    "piclaw.instance": "smith",
    "piclaw.model": "azure-openai/gpt-5-4",
    "piclaw.turn.status": "success",
    "piclaw.turn.duration_ms": 4523,
    "piclaw.turn.output_chars": 1280
  }
}{
"name": "agent.turn",
"status": { "code": "ERROR", "message": "Prompt completed without emitting an assistant reply..." },
"duration": "8912ms",
"attributes": {
"piclaw.chat_jid": "web:default:branch:0f3858079ad7",
"enduser.id": "web:default:branch:0f3858079ad7",
"enduser.pseudo.id": "web:default:branch:0f3858079ad7",
"session.id": "session-leaf-123",
"piclaw.instance": "smith",
"piclaw.model": "azure-openai/gpt-5-4",
"piclaw.turn.status": "error"
},
"events": [
{
"name": "exception",
"attributes": {
"exception.type": "Error",
"exception.message": "Prompt completed without emitting an assistant reply before finalization..."
}
}
]
}{
"name": "model.call",
"kind": "CLIENT",
"status": { "code": "OK" },
"duration": "1280ms",
"attributes": {
"piclaw.chat_jid": "web:default",
"piclaw.turn_id": "turn_abcd1234",
"piclaw.model": "azure-openai/gpt-5-4",
"piclaw.model.sequence": 2,
"piclaw.model.call_duration_ms": 1680,
"piclaw.model.response_duration_ms": 1280,
"piclaw.model.response_start_latency_ms": 400,
"piclaw.model.time_to_first_output_ms": 520,
"piclaw.model.time_to_first_text_ms": 840,
"piclaw.model.generation_duration_ms": 720,
"piclaw.model.text_generation_duration_ms": 400,
"piclaw.model.output_tokens_per_second": 50,
"piclaw.model.non_reasoning_output_tokens_per_second": 45,
"piclaw.model.stop_reason": "toolUse",
"piclaw.model.duration_ms": 1280
}
}{
"name": "tool.call",
"status": { "code": "OK" },
"duration": "320ms",
"attributes": {
"piclaw.chat_jid": "web:default",
"piclaw.instance": "smith",
"piclaw.tool.name": "bash",
"piclaw.tool.duration_ms": 320
}
}{
"name": "provider.error",
"status": { "code": "ERROR", "message": "429 Too Many Requests" },
"attributes": {
"piclaw.chat_jid": "web:default",
"piclaw.instance": "relay",
"piclaw.error.classifier": "rate_limit"
},
"events": [
{ "name": "exception", "attributes": { "exception.message": "429 Too Many Requests" } }
]
}Piclaw emits one model.call.start and one model.response.end record for each provider call, including calls resumed after tool results. The add-on uses those records for the model.call span and exports provider/model-dimensional Graphite metrics.
| Measurement | Definition |
|---|---|
| Call duration | Model-call start through assistant completion; includes context conversion, auth, request dispatch and provider work |
| Response duration | Provider stream start through assistant completion |
| Response-start latency | Model-call start through provider stream start |
| First observed output | Model-call start through the first non-empty thinking/text/tool-call delta, or a tool-call start when no argument delta has arrived |
| First visible text | Model-call start through the first non-empty text delta |
| Generation duration | First-to-last observed output interval |
| Text generation duration | First-to-last non-empty text interval |
| Reported output tokens/s | Provider-reported output tokens divided by response duration; output may include reasoning tokens |
| Non-reasoning output tokens/s | (output - reasoning) divided by response duration; emitted only when the provider reports a reasoning-token subset |
These are client-observed measurements. A provider that keeps reasoning encrypted or hidden cannot expose its true first internally generated token, so first_output_ms is not a universal server-side TTFT measurement. Zero-duration and missing-usage samples omit rates instead of emitting infinity or fabricated values.
Piclaw versions without model.call.start and the detailed model.response.end timing fields retain legacy model.call.duration_ms telemetry. Detailed latency, generation and provider/model speed metrics appear after the core timing contract is available.
Piclaw persists one bounded compaction_telemetry row per physical compaction generation. Joined callers do not create duplicate rows. The add-on converts live compaction.telemetry records to OTel spans and polls the durable table for restart-safe Graphite delivery.
Fields are limited to canonical provider/model, method, execution, trigger, terminal outcome, timeout stage, durations, request/chunk counts, and settlement status. Prompts, summaries, chat identifiers, provider URLs, headers, credentials, and raw error text are never exported.
Duration metrics use milliseconds. For one provider request, deterministic and provider-generation phases are derived from exact request/first-output/last-output timestamps. Multi-request progressive runs leave ambiguous phase durations absent rather than inventing precision.
# Agent turns
piclaw.smith.agent.turn.count 1 1745828400
piclaw.smith.agent.turn.duration_ms 4523 1745828400

# Model speed (provider/model dimensional)
piclaw.smith.model.github-copilot.gpt-5_6-sol.call.count 1 1745828400
piclaw.smith.model.github-copilot.gpt-5_6-sol.duration.call_ms 1680 1745828400
piclaw.smith.model.github-copilot.gpt-5_6-sol.duration.response_ms 1280 1745828400
piclaw.smith.model.github-copilot.gpt-5_6-sol.latency.first_output_ms 520 1745828400
piclaw.smith.model.github-copilot.gpt-5_6-sol.latency.first_text_ms 840 1745828400
piclaw.smith.model.github-copilot.gpt-5_6-sol.throughput.output_tokens_per_second 50 1745828400
piclaw.smith.model.github-copilot.gpt-5_6-sol.throughput.non_reasoning_output_tokens_per_second 45 1745828400
piclaw.smith.agent.turn.success 1 1745828400

# Tool calls
piclaw.smith.tool.bash.count 1 1745828400
piclaw.smith.tool.bash.duration_ms 320 1745828400

# Recovery
piclaw.smith.recovery.attempts 2 1745828400
piclaw.smith.provider.error.rate_limit 1 1745828400

# Session lifecycle
piclaw.smith.session.created 1 1745828400
piclaw.smith.session.evicted 1 1745828400

# Dream
piclaw.smith.dream.duration_ms 45000 1745828400

# Durable usage (provider/model/metric)
piclaw.smith.usage.github-copilot.gpt_5_6_sol.tokens.total 48000 1745828400
piclaw.smith.usage.github-copilot.gpt_5_6_sol.cost.estimated_usd 0.24 1745828400

# Compaction (provider/model/method/execution/trigger/outcome/timeout-stage)
piclaw.smith.compaction.local.fast-summary.selective.single_pass.manual.success.none.attempt.count 1 1745828400
piclaw.smith.compaction.local.fast-summary.selective.single_pass.manual.success.none.input.tokens 48000 1745828400
piclaw.smith.compaction.local.fast-summary.selective.single_pass.manual.success.none.duration.ttft_ms 700 1745828400
piclaw.smith.compaction.local.fast-summary.selective.single_pass.manual.success.none.duration.total_ms 1200 1745828400
Queryable as:
piclaw.*.agent.turn.error          # errors across all instances
piclaw.smith.tool.*.duration_ms    # all tool durations on smith
piclaw.relay.provider.error.*      # all provider errors on relay
piclaw.*.model.*.*.throughput.output_tokens_per_second  # reported output throughput by provider/model
piclaw.*.model.*.*.latency.first_text_ms                # visible-text latency by provider/model
piclaw.*.usage.*.*.tokens.total    # usage across all instances
piclaw.*.compaction.*.*.*.*.*.*.*.duration.ttft_ms  # TTFT across bounded compaction dimensions
Version 0.1.14 changed durable metrics from piclaw.usage.<instance>... and piclaw.compaction.<instance>... to the instance-first paths above. Existing Graphite history stays under the old paths. The exporters rewrite pending local retry-spool entries before sending them, but they do not dual-write or copy historical Graphite data.
| Feature | What it shows |
|---|---|
| Application Map | All piclaw instances with health and dependency links |
| Failures blade | Errors grouped by cloud_RoleInstance: smith 2, relay 5, orangepi 1 |
| Transaction Search | Individual turn traces with model.call and tool.call child spans |
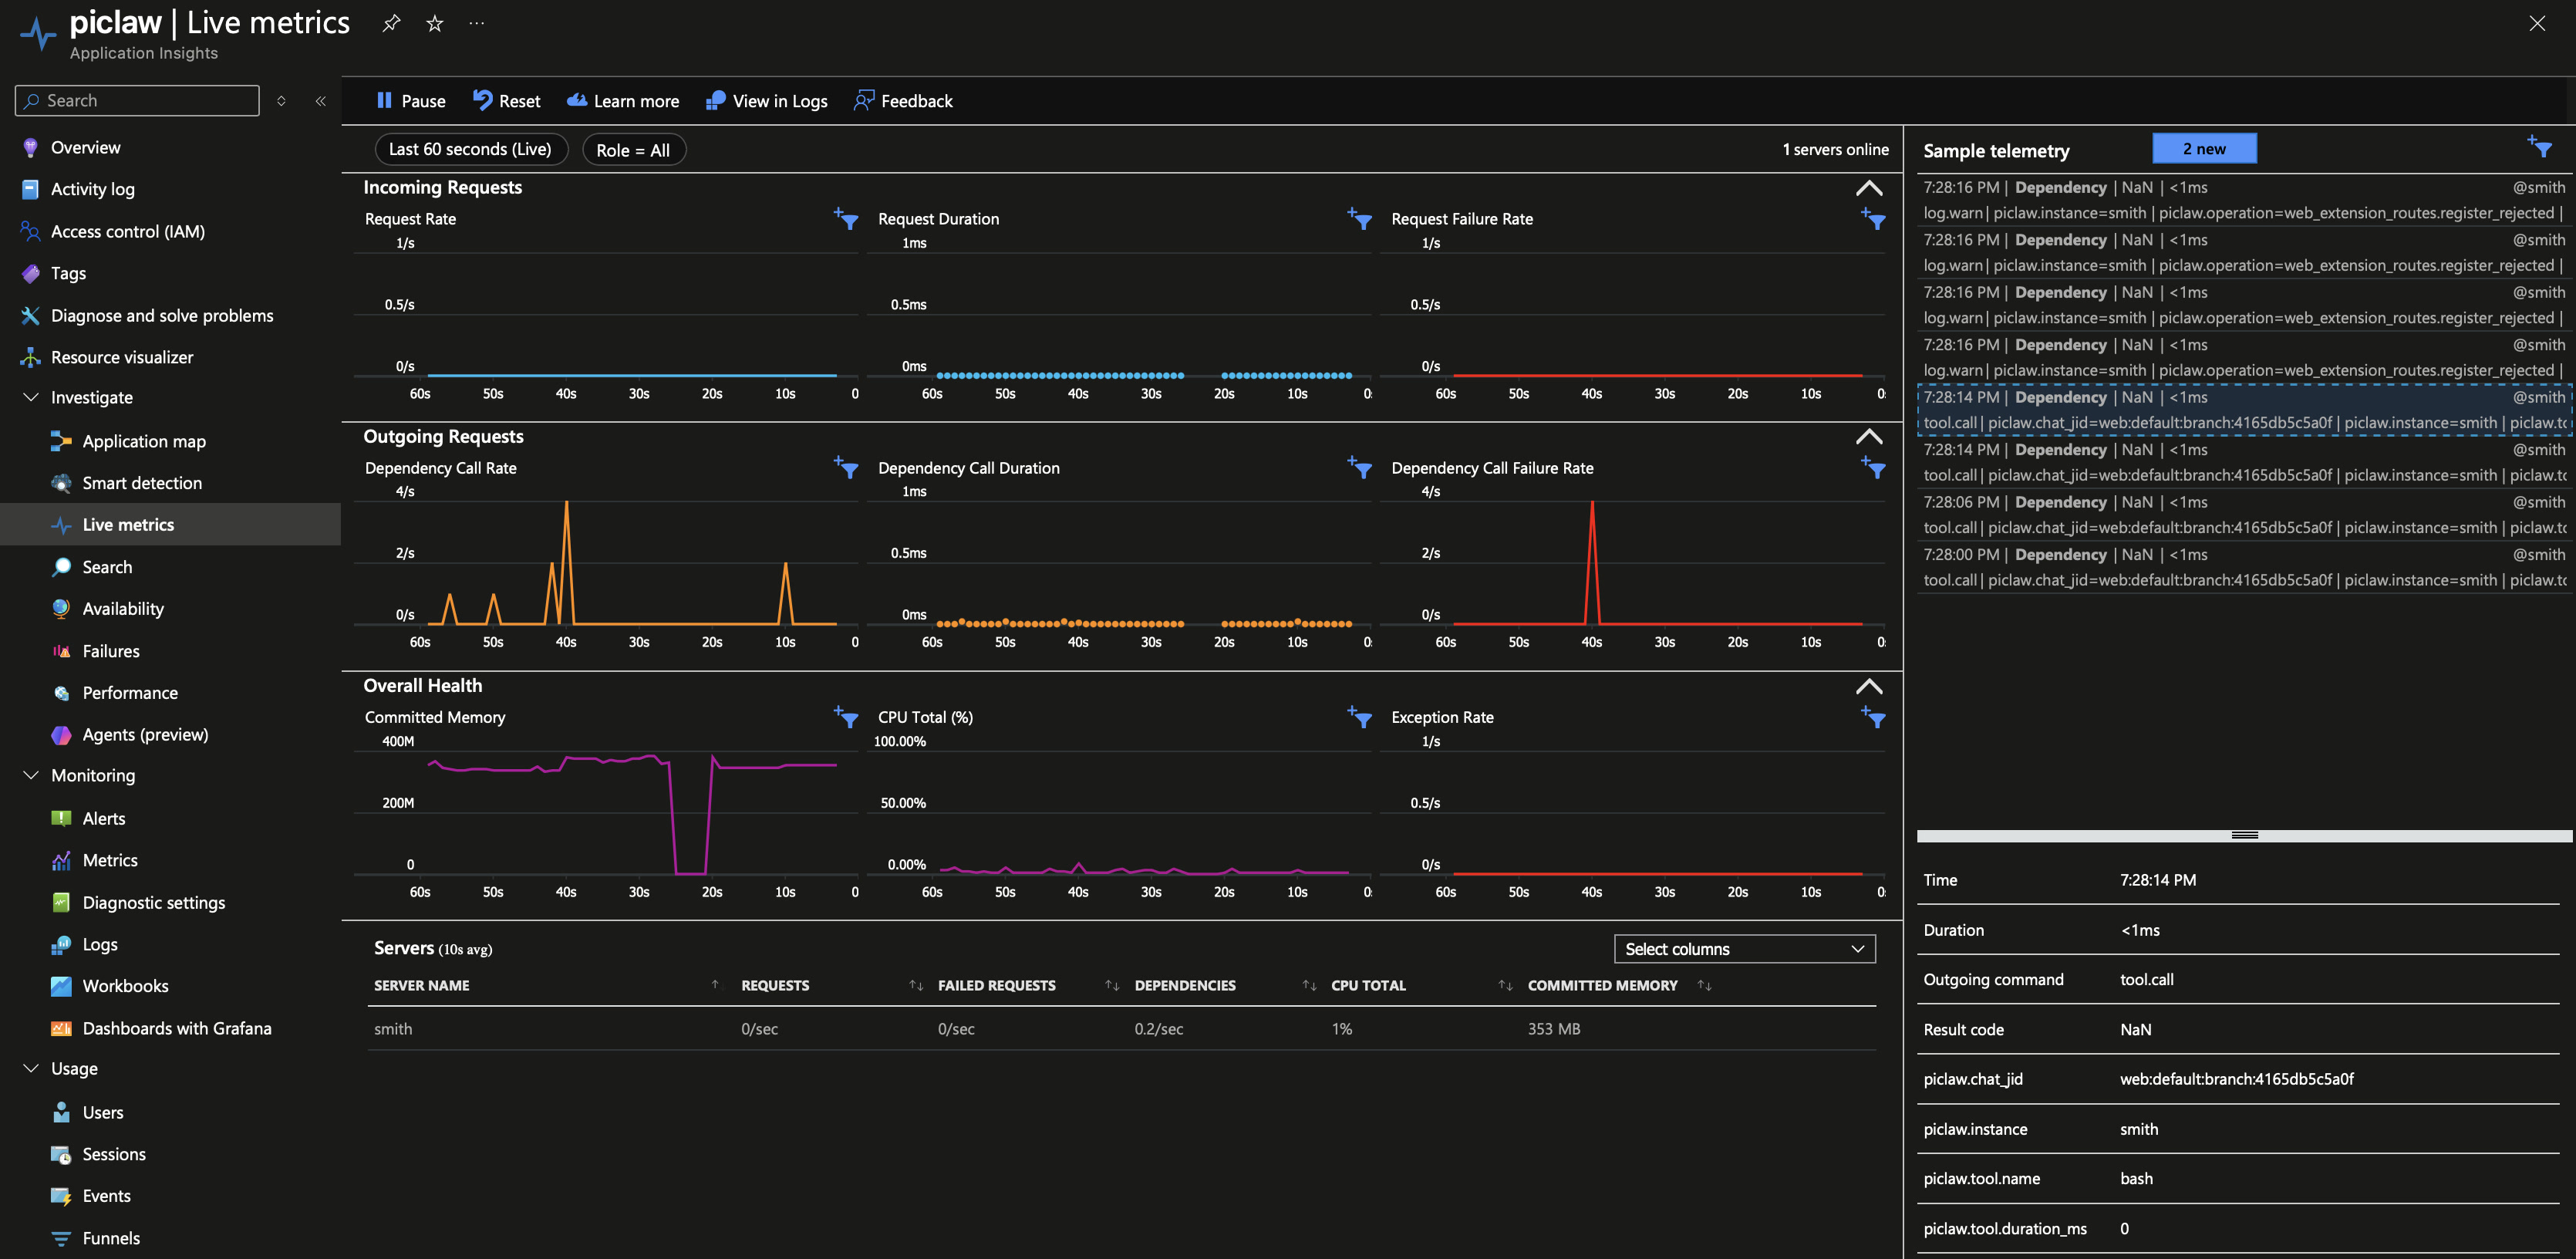
| Live Metrics Stream | agent.turn maps more naturally to Incoming Requests, while model.call and tool.call map more naturally to outgoing dependency metrics |
| Users / Sessions | Backend-derived actor/session fields: chatJid maps to App Insights user fields; sessionLeafId maps to queryable session dimensions |
Important: the addon now synthesizes telemetry classes intentionally:
agent.turn→ request-style span (for Incoming Requests / request rate / request duration)model.callandtool.call→ dependency-style spans (for outgoing dependency metrics)provider.error,log.error, and failed spans → exceptions / failuresPiclaw also stamps a synthetic result code onto spans so
resultCodeis no longerNaNin App Insights for custom telemetry:200=info/success,300=warn,400=error.
Use these in Azure Application Insights → Logs.
The piclaw repo also includes companion artifacts:
docs/azure/app-insights-agent-kusto-queries.mddocs/azure/app-insights-agent-observability-workbook-template.jsonunion withsource=table requests, dependencies, traces, exceptions
| extend piclaw_instance = coalesce(tostring(customDimensions["piclaw.instance"]), cloud_RoleInstance)
| where timestamp > ago(30m)
| where cloud_RoleName == "piclaw" or isnotempty(piclaw_instance)
| extend item_name = coalesce(name, operation_Name, message, outerMessage)
| project timestamp, table, piclaw_instance, item_name, success, resultCode, severityLevel, operation_Id
| order by timestamp descagent.turn, model.call, tool.call, provider.error, dream, log.*)union withsource=table requests, dependencies, traces, exceptions
| extend piclaw_instance = coalesce(tostring(customDimensions["piclaw.instance"]), cloud_RoleInstance)
| extend span_name = coalesce(name, operation_Name, message, outerMessage)
| where timestamp > ago(6h)
| where span_name in ("agent.turn", "model.call", "tool.call", "provider.error", "dream", "log.error", "log.warn")
| project timestamp,
table,
piclaw_instance,
span_name,
success,
duration,
operation_Id,
chat_jid = tostring(customDimensions["piclaw.chat_jid"]),
model = tostring(customDimensions["piclaw.model"]),
tool_name = tostring(customDimensions["piclaw.tool.name"]),
turn_status = tostring(customDimensions["piclaw.turn.status"]),
classifier = tostring(customDimensions["piclaw.error.classifier"])
| order by timestamp descunion withsource=table requests, dependencies, traces, exceptions
| where timestamp > ago(24h)
| extend chat_jid = coalesce(user_AuthenticatedId, tostring(customDimensions["piclaw.chat_jid"]))
| extend session_id = coalesce(session_Id, tostring(customDimensions["ai.session.id"]), tostring(customDimensions["session.id"]), tostring(customDimensions["piclaw.session.id"]))
| where isnotempty(chat_jid)
| summarize items = count(), sessions = dcount(session_id), failures = countif(success == false or severityLevel >= 3) by chat_jid
| order by items descrequests
| extend piclaw_instance = coalesce(tostring(customDimensions["piclaw.instance"]), cloud_RoleInstance)
| where timestamp > ago(24h)
| where name == "agent.turn"
| extend duration_ms = todouble(duration / 1ms)
| summarize turns = count(),
errors = countif(success == false or tostring(customDimensions["piclaw.turn.status"]) == "error"),
p50_ms = percentile(duration_ms, 50),
p95_ms = percentile(duration_ms, 95),
p99_ms = percentile(duration_ms, 99)
by piclaw_instance
| order by turns descdependencies
| extend piclaw_instance = coalesce(tostring(customDimensions["piclaw.instance"]), cloud_RoleInstance)
| where timestamp > ago(24h)
| where name == "tool.call"
| extend duration_ms = todouble(duration / 1ms)
| summarize calls = count(),
errors = countif(success == false),
p50_ms = percentile(duration_ms, 50),
p95_ms = percentile(duration_ms, 95)
by piclaw_instance, tool_name = tostring(customDimensions["piclaw.tool.name"])
| order by calls descrequests
| extend piclaw_instance = coalesce(tostring(customDimensions["piclaw.instance"]), cloud_RoleInstance)
| where timestamp > ago(24h)
| where name == "agent.turn"
| extend model = tostring(customDimensions["piclaw.model"])
| where isnotempty(model)
| extend duration_ms = todouble(duration / 1ms)
| summarize turns = count(),
errors = countif(success == false or tostring(customDimensions["piclaw.turn.status"]) == "error"),
total_duration_ms = sum(duration_ms),
p50_ms = percentile(duration_ms, 50),
p95_ms = percentile(duration_ms, 95)
by piclaw_instance, model
| order by turns descunion withsource=table dependencies, traces, exceptions
| extend piclaw_instance = coalesce(tostring(customDimensions["piclaw.instance"]), cloud_RoleInstance)
| extend span_name = coalesce(name, operation_Name, message, outerMessage)
| extend provider = tostring(customDimensions["piclaw.provider"])
| extend classifier = tostring(customDimensions["piclaw.error.classifier"])
| where timestamp > ago(24h)
| where span_name == "provider.error" or isnotempty(provider) or isnotempty(classifier)
| summarize events = count(),
failures = countif(success == false or severityLevel >= 3)
by piclaw_instance, provider, classifier, span_name, table
| order by events descunion withsource=table dependencies, traces, exceptions
| extend piclaw_instance = coalesce(tostring(customDimensions["piclaw.instance"]), cloud_RoleInstance)
| extend span_name = coalesce(name, operation_Name, message, outerMessage)
| where timestamp > ago(24h)
| where span_name in ("provider.error", "log.error", "log.warn")
or success == false
or severityLevel >= 3
| project timestamp,
table,
piclaw_instance,
span_name,
severityLevel,
success,
operation_Id,
classifier = tostring(customDimensions["piclaw.error.classifier"]),
provider = tostring(customDimensions["piclaw.provider"]),
model = tostring(customDimensions["piclaw.model"]),
message,
outerMessage,
problemId,
type
| order by timestamp descmodel.call dependency spansdependencies
| extend piclaw_instance = coalesce(tostring(customDimensions["piclaw.instance"]), cloud_RoleInstance)
| where timestamp > ago(24h)
| where name == "model.call"
| extend model = tostring(customDimensions["piclaw.model"])
| extend input_tokens = todouble(customDimensions["piclaw.model.input_tokens"])
| extend output_tokens = todouble(customDimensions["piclaw.model.output_tokens"])
| extend cache_read_tokens = todouble(customDimensions["piclaw.model.cache_read_tokens"])
| extend cache_write_tokens = todouble(customDimensions["piclaw.model.cache_write_tokens"])
| extend total_tokens = todouble(customDimensions["piclaw.model.total_tokens"])
| where isnotnull(input_tokens)
or isnotnull(output_tokens)
or isnotnull(cache_read_tokens)
or isnotnull(cache_write_tokens)
or isnotnull(total_tokens)
| summarize model_calls = count(),
input_tokens = sum(input_tokens),
output_tokens = sum(output_tokens),
cache_read_tokens = sum(cache_read_tokens),
cache_write_tokens = sum(cache_write_tokens),
total_tokens = sum(total_tokens)
by piclaw_instance, model
| order by total_tokens descdependencies
| extend piclaw_instance = coalesce(tostring(customDimensions["piclaw.instance"]), cloud_RoleInstance)
| where timestamp > ago(24h)
| where name == "model.call"
| extend model = tostring(customDimensions["piclaw.model"]),
first_output_ms = todouble(customDimensions["piclaw.model.time_to_first_output_ms"]),
first_text_ms = todouble(customDimensions["piclaw.model.time_to_first_text_ms"]),
output_tps = todouble(customDimensions["piclaw.model.output_tokens_per_second"]),
non_reasoning_tps = todouble(customDimensions["piclaw.model.non_reasoning_output_tokens_per_second"])
| summarize calls = count(),
p50_first_output_ms = percentile(first_output_ms, 50),
p95_first_output_ms = percentile(first_output_ms, 95),
p50_first_text_ms = percentile(first_text_ms, 50),
p50_output_tps = percentile(output_tps, 50),
p50_non_reasoning_tps = percentile(non_reasoning_tps, 50)
by piclaw_instance, model
| order by calls descsmith)union withsource=table requests, dependencies, traces, exceptions
| extend piclaw_instance = coalesce(tostring(customDimensions["piclaw.instance"]), cloud_RoleInstance)
| where timestamp > ago(2h)
| where piclaw_instance == "smith"
| extend item_name = coalesce(name, operation_Name, message, outerMessage)
| project timestamp, table, item_name, success, duration, severityLevel, operation_Id
| order by timestamp descunion withsource=table requests, dependencies, traces
| extend piclaw_instance = coalesce(tostring(customDimensions["piclaw.instance"]), cloud_RoleInstance)
| extend item_name = coalesce(name, operation_Name, message)
| where timestamp > ago(15m)
| where item_name in ("agent.turn", "tool.call", "provider.error", "dream", "log.error", "log.warn")
| summarize count() by table, item_name, piclaw_instance
| order by count_ desc@azure/monitor-opentelemetry ^1.16 — official Azure Monitor OTel distro (includes Live Metrics)@opentelemetry/api ^1.9 — OTel trace + context APIusage-telemetry-chart